How to Read Quarterly Earnings Reports: The Complete Beginner’s Guide (2025)
- Felix La Spina
- Jun 23, 2025
- 3 min read

Earnings season can feel overwhelming, especially if you’re new to investing or just starting to analyze financial documents. But understanding quarterly earnings reports is a powerful skill that helps you make smarter, data-driven investment decisions. These reports provide a snapshot of a company’s financial health and performance over three months.
By learning how to dissect income statements, balance sheets, cash flow statements, and management guidance, you’ll quickly gain confidence in evaluating any company’s performance.
Quick Wins: 3 Things to Check First
Short on time? Start here:
Revenue & Net Income: Are they growing quarter over quarter (QoQ) and year over year (YoY)?
Operating Margin: Is the company earning more profit on every dollar of sales?
Debt Levels: Is the company’s debt rising faster than its assets or equity
What’s in a Quarterly Earnings Report?
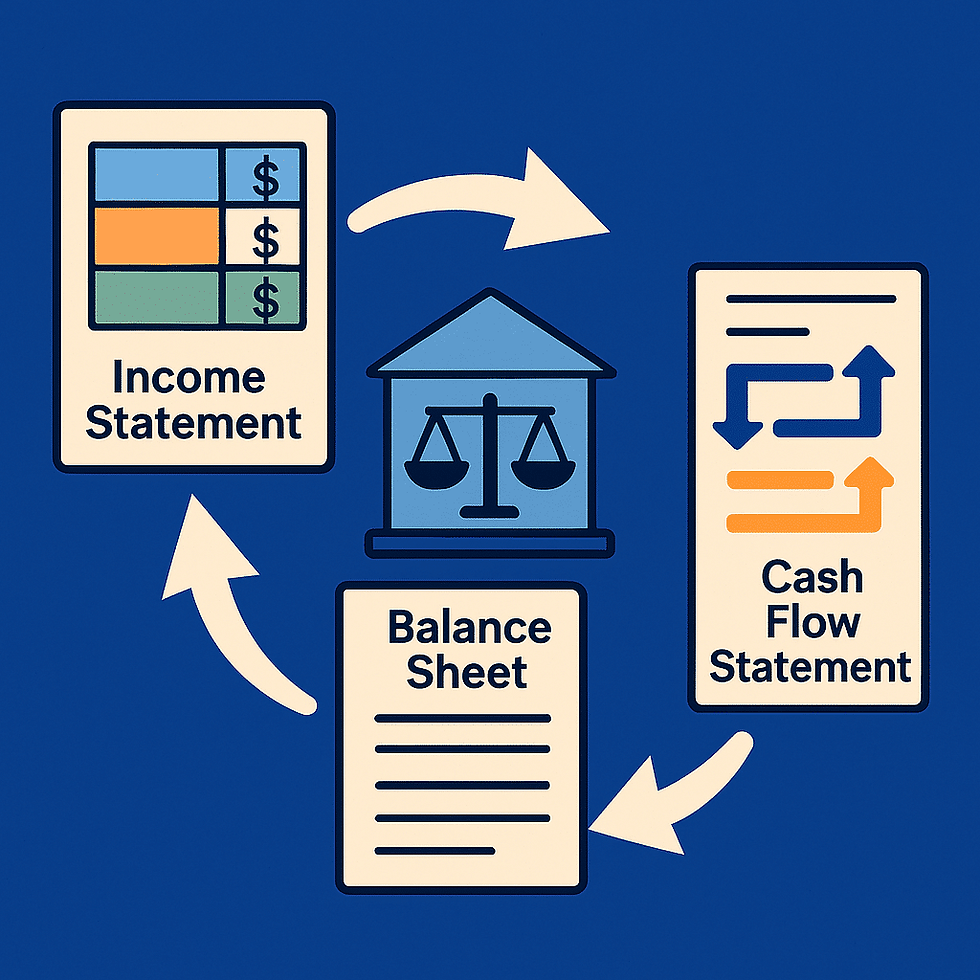
Quarterly earnings reports usually include three key financial statements:
Income Statement
Balance Sheet
Cash Flow Statement

Each statement reveals different clues about a company’s financial health, growth, and profitability. Here’s how to break down each one:
Step 1: How to Read an Income Statement
The income statement (also known as the profit and loss, or P&L) shows how much revenue a company earned and the expenses it incurred during the quarter.
Example:
Key Metrics to Watch
Top Line: Revenue earned from sales and services.
Bottom Line: Net income after all expenses and taxes.
Pro Tip: Ask: Did revenue and net income grow compared to last quarter (QoQ) or last year (YoY)?
Operating Margin
Formula: (Operating Income / Revenue) × 100 Higher margins mean the company is managing costs efficiently.
Red Flag: If operating expenses are rising faster than revenue, efficiency may be slipping.
Step 2: Balance Sheet Analysis Made Simple
The balance sheet provides a snapshot of what a company owns (assets), owes (liabilities), and what’s left for shareholders (equity) at a specific point in time. Example:
Key Ratios
Debt-to-Equity Ratio: Total Liabilities ÷ Total EquityA high ratio = higher risk from too much debt.
Working Capital: Current Assets – Current LiabilitiesPositive working capital means the company can cover short-term expenses.
Did You Know? A declining cash balance with rising debt can signal future trouble.
Step 3: Understanding the Cash Flow Statement
While the income statement shows profit, the cash flow statement explains how cash moves through the business.
Sections of a Cash Flow Statement
Operating Activities: Cash from core business operations.
Investing Activities: Cash used for buying/selling assets, equipment, or acquisitions.
Financing Activities: Cash raised through debt or equity, or paid out as dividends.
Quick Tip: Look for companies with consistent, positive cash flow from operating activities.
Red Flags to Watch For
Declining Revenue: Multiple quarters of falling sales.
Stagnant or Negative Operating Margin: Margins that don’t improve may signal weak management or rising costs.
Rising Debt: If debt grows faster than assets or equity, financial health could be at risk.
Stock Dilution: Too many new shares issued lower your share of the company.
Missed Expectations or Reduced Guidance: Signals future struggles or challenges.
How to Interpret Management Guidance
Management often provides “guidance” on what to expect for the next quarter or year. Here’s how to use it:
Does Guidance Match Analyst Expectations? If guidance falls short, stocks may drop.
Management’s Tone: Vague, defensive, or overly optimistic answers in earnings calls can signal uncertainty.
Key Metrics: Look for updates on earnings per share (EPS), revenue growth, and free cash flow (FCF).
Pro Tip: Free cash flow is king! It shows what’s left over to reinvest, pay dividends, or buy back shares.

Mini Case Study: Spotting Trends in a Real Report
Imagine this scenario:
You’re reading “TechWidgets Inc.” quarterly earnings:
Revenue: Up 8% YoY, up 3% QoQ
Net Income: Up 5% YoY, flat QoQ
Operating Margin: 18% this quarter, 17% last quarter, 14% same quarter last year
Debt-to-Equity Ratio: 0.7 (low risk)
Operating Cash Flow: Steady, positive
What you spot:Growth is steady, not explosive, but margins are improving, meaning the company is becoming more efficient. Debt is manageable, and no major red flags appear.
Conclusion:TechWidgets Inc. looks healthy, with steady improvements and no warning signs.
Quick Reference Table: What to Check in Each Report
Frequently Asked Questions (FAQs)
Q: How often are earnings reports released? A: Every three months (quarterly). Check the company’s investor relations site for exact dates.
Q: What’s the difference between QoQ and YoY growth? A: QoQ = quarter over quarter; YoY = year over year (same quarter, previous year).
Q: Can earnings reports predict stock prices? A: Positive surprises usually boost stocks; negative surprises can cause declines.
Actionable Steps
Practice reading earnings reports from companies you follow.
Focus on patterns in revenue, margins, debt, and cash flow.
Look for red flags and management commentary.
Use the quick reference table for every report you read.
With these tools in hand, you’re ready to analyze quarterly earnings reports with confidence. Happy investing!
Comments